Drift detection: statistical methods for non-stationary process drift isolation
While anomaly detection tools spot a single, sudden weird reading, drift detection tools look at the bigger picture. They notice when the baseline level of a system is slowly drifting over time, accumulating tiny, subtle changes that would look perfectly normal if judged on their own.
Anomaly detection flags samples. Drift detection flags a change of the average — something that happens over many samples, each of which looks plausible on its own.
A worn gear makes a joint move a little less smoothly over hours: no single sample is unusual, but the average has moved. A per-sample detector misses this by construction: every sample is inside the local window's amplitude, so nothing fires. A drift detector accumulates the small deviations and raises one alarm when the accumulated evidence is too large to be explained by noise.
The signal
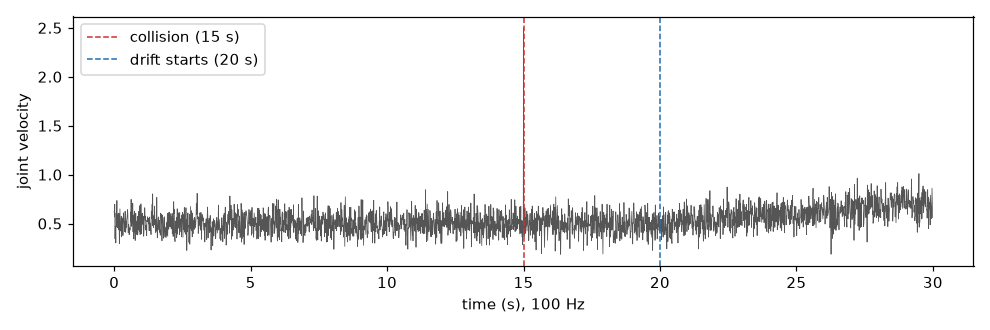
The same 100 Hz joint velocity: a worn gear starts shifting the average at sample 2000 (second 20) and pushes it up by 0.2 rad/s over the next 10 seconds. The spike at sample 1500 is the anomaly detector's job; the drift from sample 2000 onward is the drift detector's.
Pages
- CUSUM and ARL theory — the cumulative-sum detector (accumulate small deviations, alarm when the sum passes a threshold), its streaming version, and how long it takes to fire — or to false-alarm — before running it.