Single ticker: dual-model online anomaly isolation for individual equity monitoring
For a single financial asset, two detectors look for days that differ from ordinary market conditions. Instead of just looking at price changes, this tool processes price and trading volume together day by day, requiring a strict consensus from two different algorithms before marking a day as truly unusual to shield analysts from false alarms.
The scene
A portfolio manager follows Apple. Every morning she opens the charts and wants one thing: is today one of those days when Apple behaves differently, or is it a normal Thursday?
Two detectors answer the question together. Only when both agree, the day is flagged.
What is in the box
| Tool | Its one job | Example |
|---|---|---|
| LODA | Score how strange a day is, given several numbers | Price and volume together, not just price |
| Half-Space Trees | Same job as LODA, done another way | A second opinion on the same day |
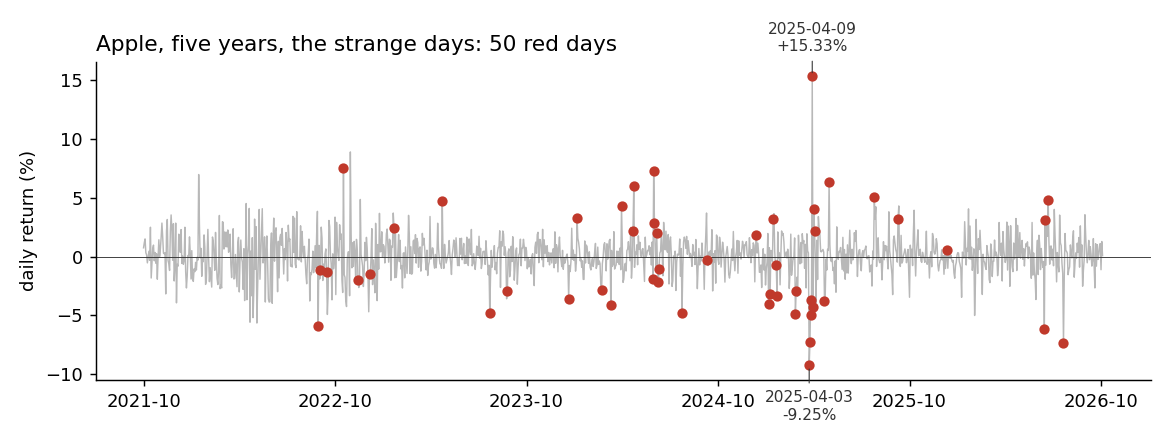
Each red dot is a day flagged by both LODA and Half-Space Trees on Apple.
1. A strangeness score (LODA)
Price and volume usually move together. When they do not, something is off. LODA looks at the pair and gives a score: low for an ordinary day, high for a strange one.
2. A second opinion (Half-Space Trees)
Half-Space Trees does the same job, but by cutting the space into rectangles instead of projections. When both detectors give a high score, the day is flagged.
The chain
For each new day:
- The return and the relative volume go to LODA.
- The same pair goes to Half-Space Trees.
- If both scores are above their adaptive thresholds, the day is flagged. Otherwise it is not.
What you get on Apple over five years
Apple, 1,253 trading days. Ranges calibrated on the first 250 days.
| Metric | Value |
|---|---|
| Days tested | 1,253 |
| Days flagged anomalous | 50 (47 after the 250-day calibration) |
| Time per day | 0.59 ms median (Kaggle CPU) |
The 50 days include the crashes of April 3rd and 4th 2025 (−9.25% and −7.29%), the rebound of April 9th 2025 (+15.33%), the rise of June 11th 2024 (+7.26%, the day after the Apple Intelligence announcement), and 7 quarterly-expiration Fridays, when volume moves without the price moving much.
The same detectors on other stocks. Over the same 1,253 days, Microsoft has 66 flagged days and Tesla 38. Each stock is compared with its own recent past.
When you need it
- A single stock that a portfolio manager follows closely.
- A pair trade where one leg is watched and the other is hedged.
- A retail investor who wants one number a day for one ticker.
Details
Implementation
The pipeline is in pipelines/finance/single_ticker.py.
Primitives chained, each with its own page:
References
- Lou, B., Boland, D., Leong, P. H. W. (2024). fSEAD. arXiv:2406.05999. Section 2.1 (Loda).
- Tan, S. C., Ting, K. M., Liu, T. F. (2011). Fast anomaly detection for streaming data. IJCAI. (Half-Space Trees.)
- Ulrich (2025). Half-Space Trees for Novelty Detection. arXiv:2505.08489.
- Market data: Yahoo Finance, Apple (AAPL), 14 October 2021 to 13 October 2026.
These pages describe measurements on historical data. Not a forecast, not financial advice.